A Map Of The Top Export And Import For Every Country

We are often told of the benefits of shopping locally and supporting our community. At the same time, however, there are many items that we can’t get unless we shop on a more global scale.
If you look around your home, you are likely to see many items that are from thousands of miles away from your home. It doesn’t matter if you are pumping gas at the gas station or drinking out of your favorite teacup, it likely came from somewhere else.

The problem is, it can be difficult to keep up with what is coming from where and what is going where. That just got a little easier, thanks to BusinessFinacing.co.uk. They break it down easily with a new map of top exports and imports for various countries.
In order to get this information accurately, they made use of the CEPII – BACI: International Trade Database. As you scan through the graphic, you are likely to see some items that are used more often than others. This includes petroleum, which is going into and coming out of many different areas.
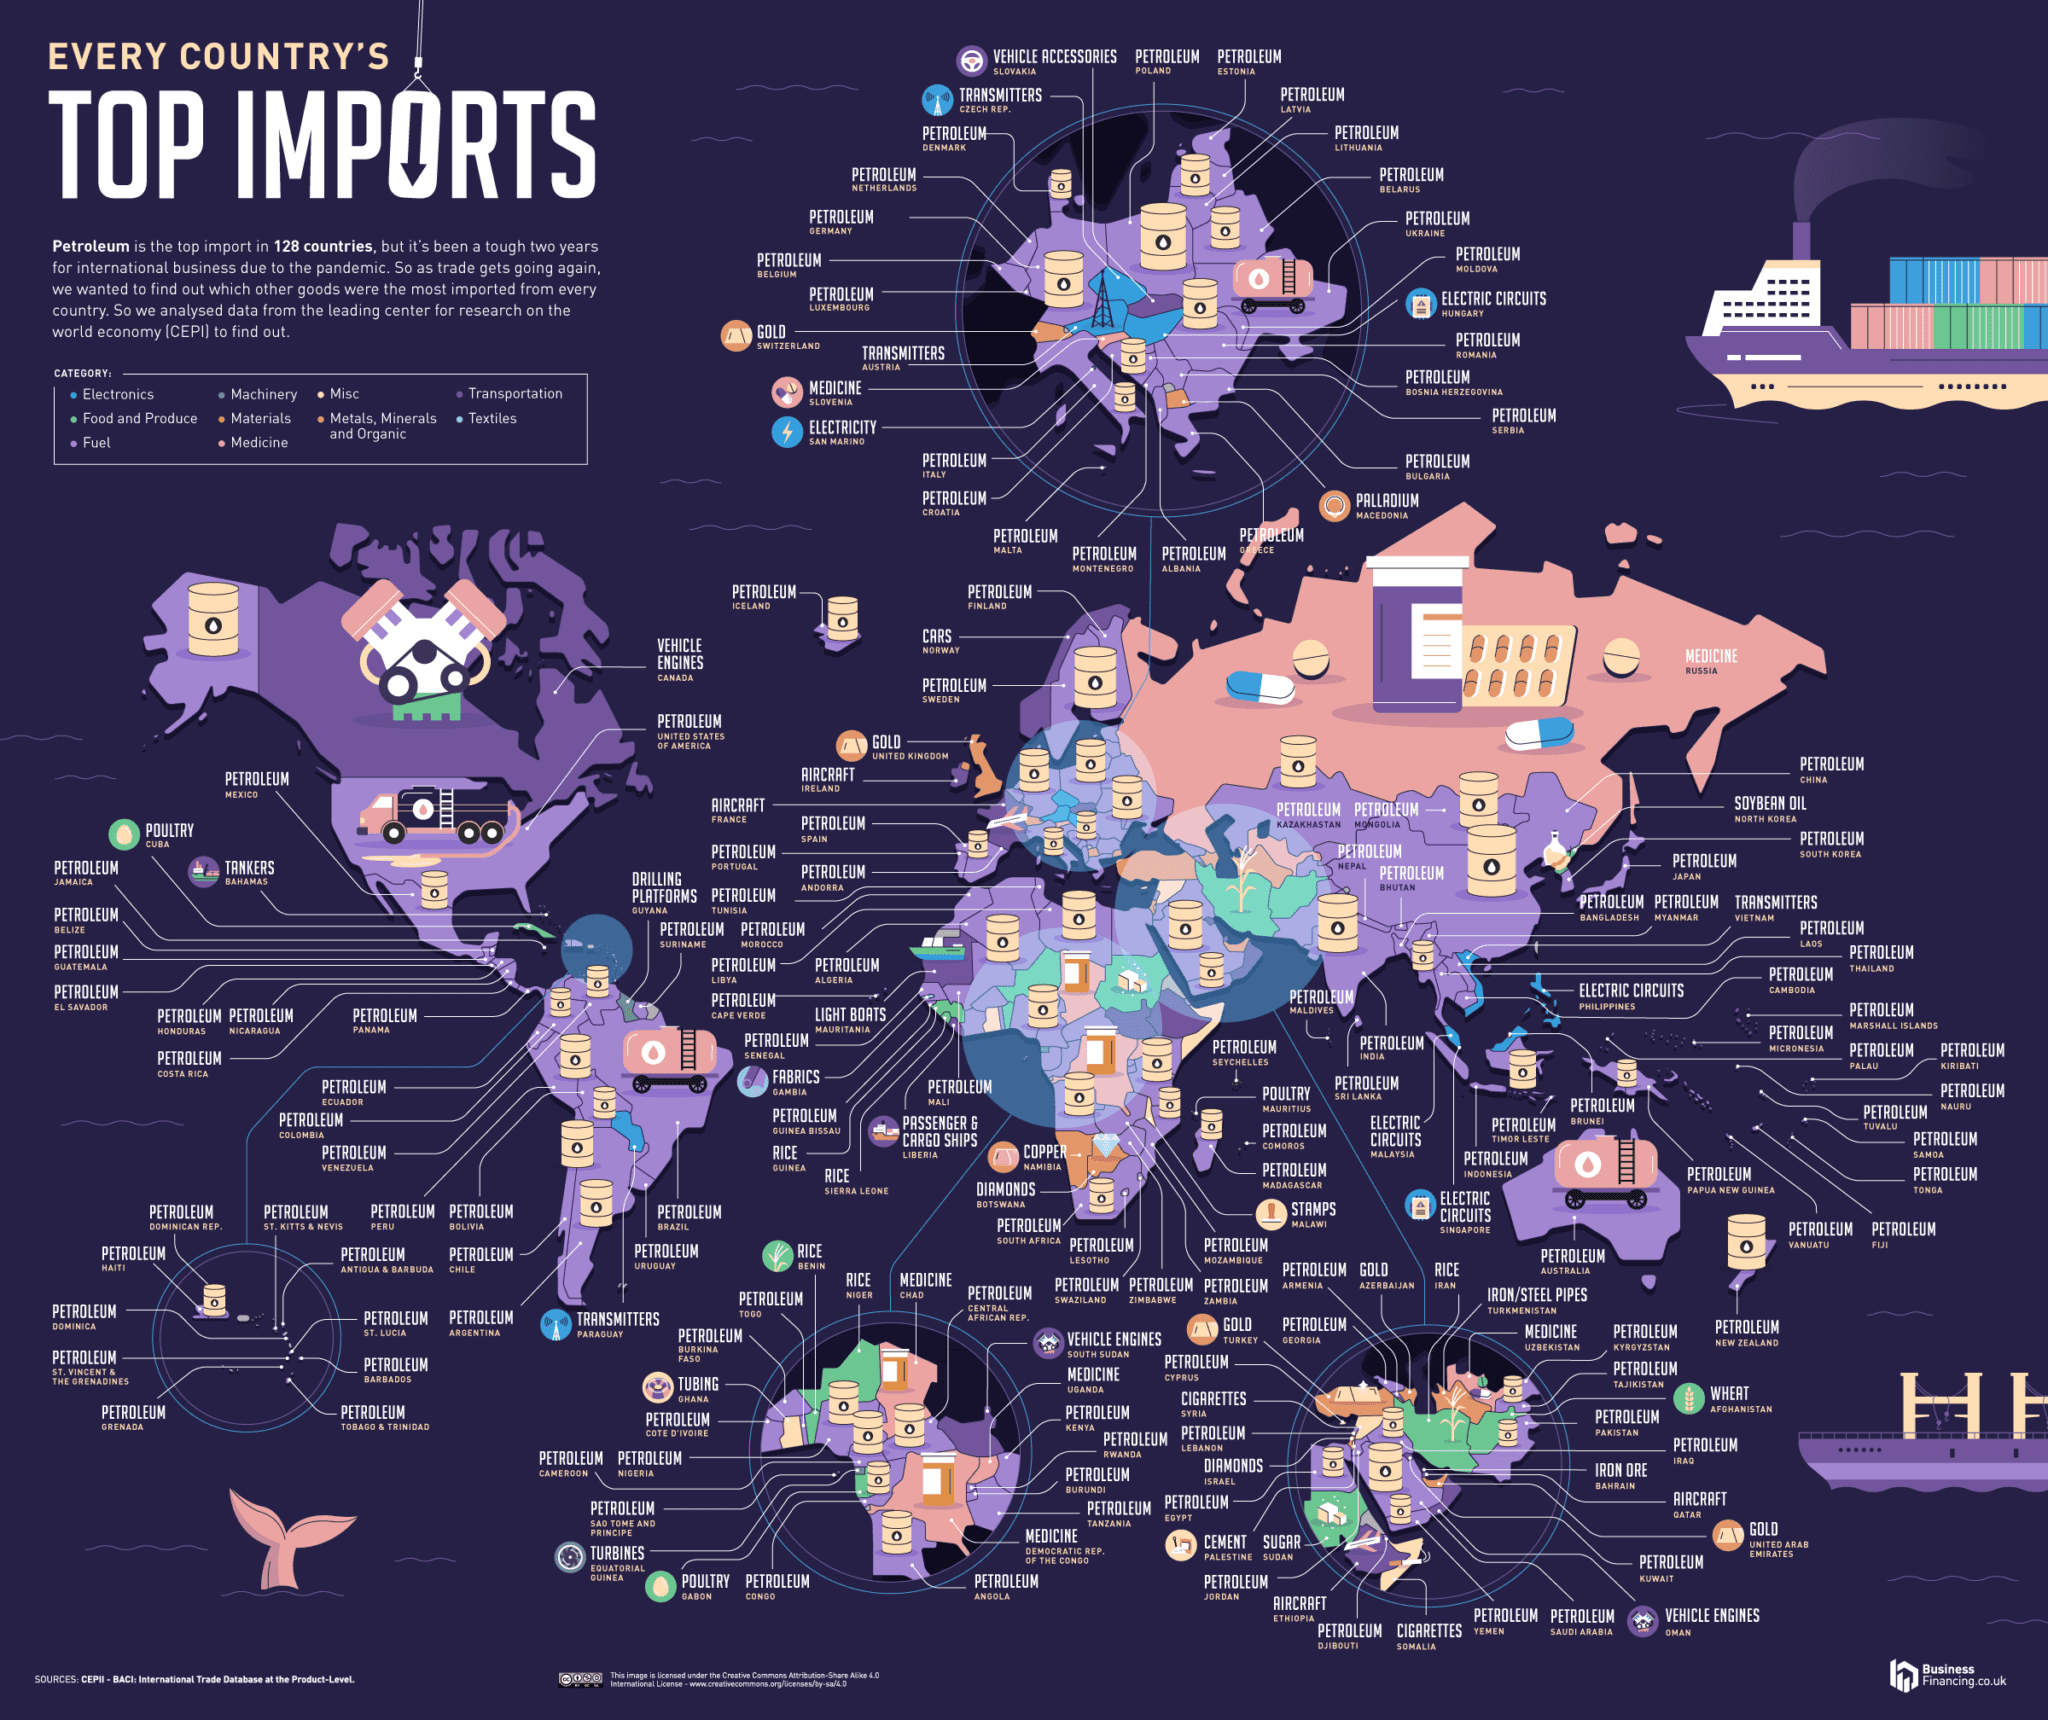
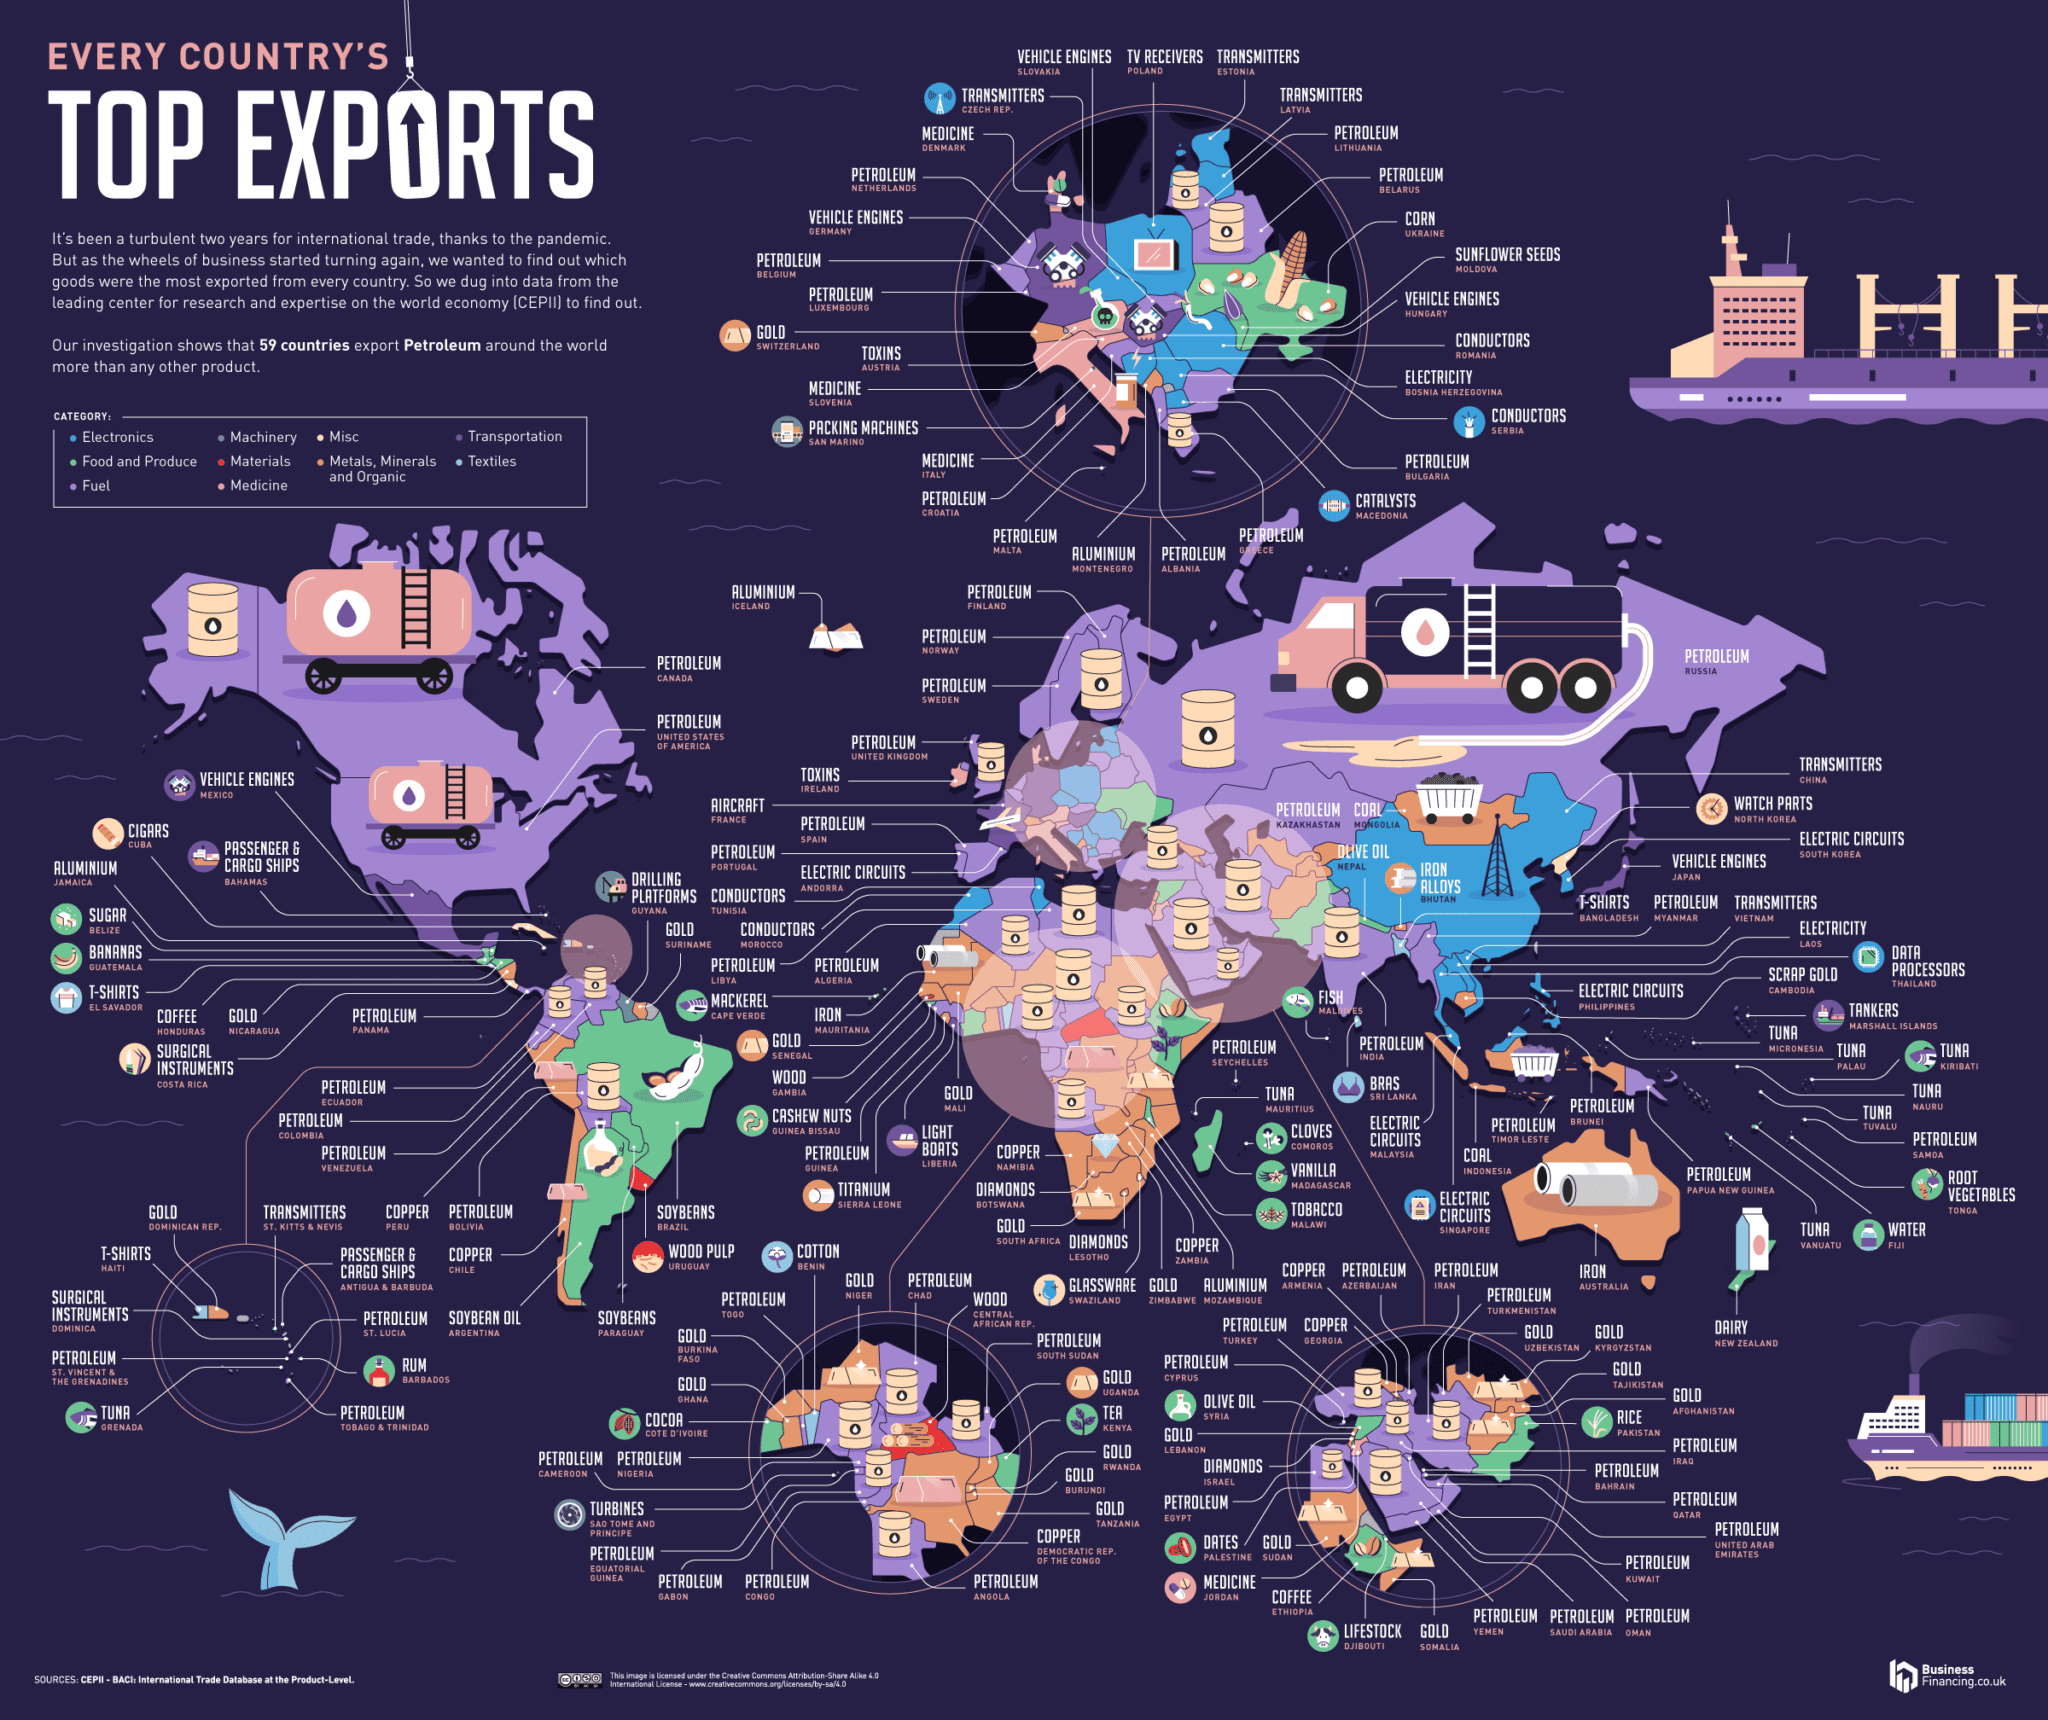
Interestingly, Canada and the UK are on the list of top exporters along with Iran. Those who import petroleum more than other items include Mexico, Australia, and China.
Gold is another resource that is crossing international lines these days. Some of the countries where it comes from include Nicaragua, Senegal, and Uganda. You will see plenty of food listed as well, including some that likely find their way into your kitchen. Do you drink coffee in the morning or enjoy a banana on occasion?

The global supply chain does change from time to time and this information is from about two years ago. Even so, it can show you what was happening prior to the pandemic and it will be interesting to see how things change now that the pandemic has made a mark on history.