
Are you an aspiring baker? Do you want to take your skills next level and be even better? Then below are some easy-to-read charts that you can follow for tips and tricks to get better.
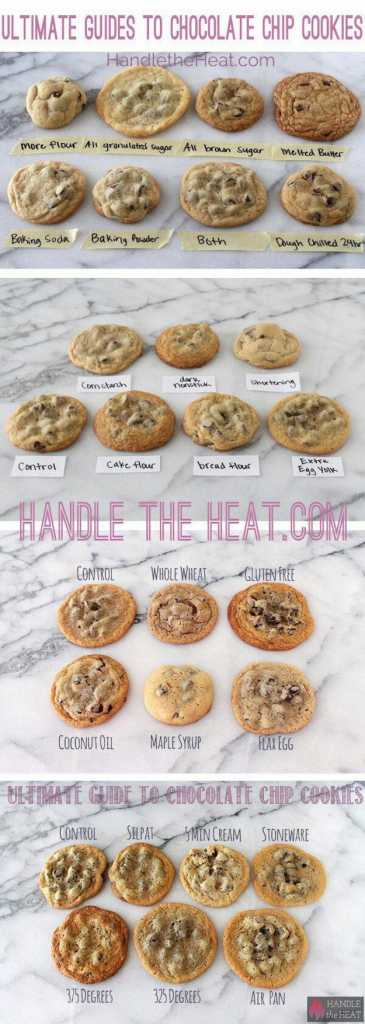
1. The Perfect Chocolate Chip Cookies
Have you ever tried to bake the perfect batch of chocolate chip cookies, only to have them come out flat or crumbly? Well, Handle the Heat has come up with the perfect chocolate chip cookie guide to explain the ins and outs of chocolate chip cookies. Apparently, melted butter produces cookies that have shiny, crackled tops and crispy edges, while chilling the dough before baking will make them chewier. Who knew?
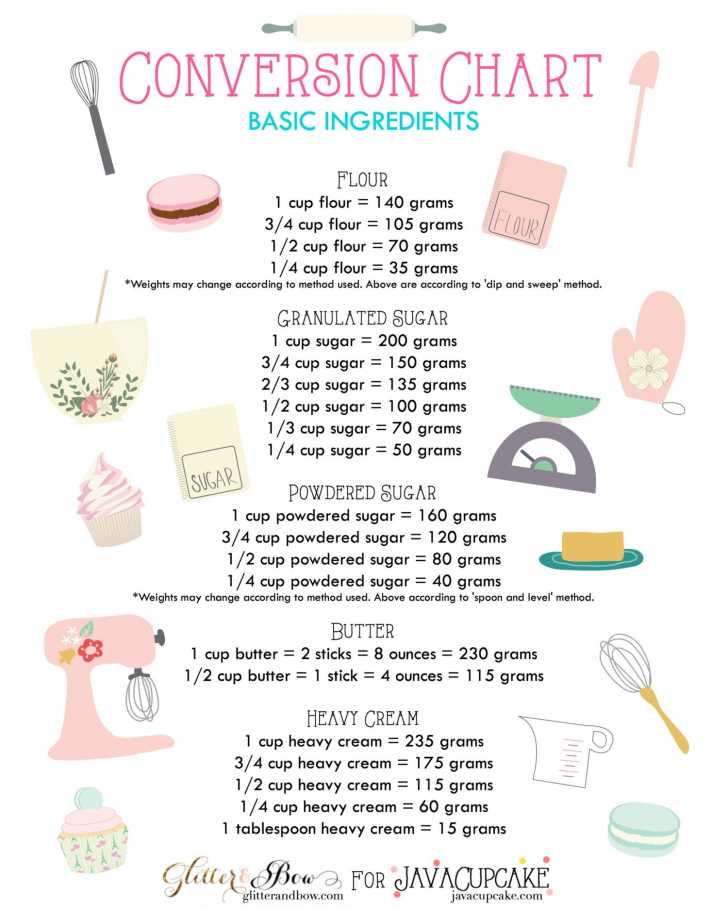
2. Baking Conversion Chart
Precision is everything when it comes to baking. This chart from Java Cupcake will be helpful in deciphering metric measurements for flour, sugar, butter, and cream if you happen to follow food bloggers from around the globe.
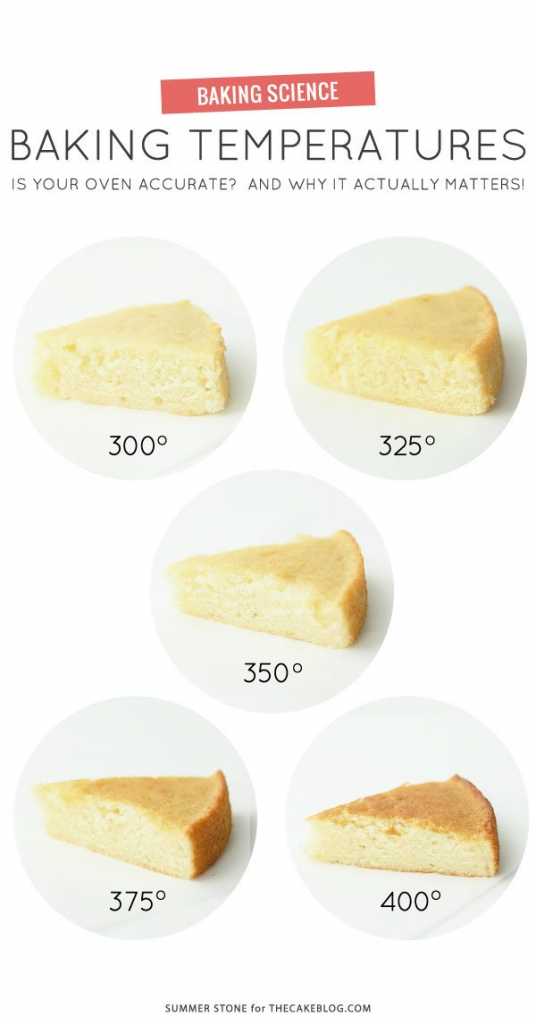
3. Baking Temperature Comparison
Oven temperature is one of the keys to baking success as well. Summer Stone with The Cake Blog did an experiment of baking at different temperatures in order to demonstrate what change in temperature can do. The chart shows the results of different temperatures.
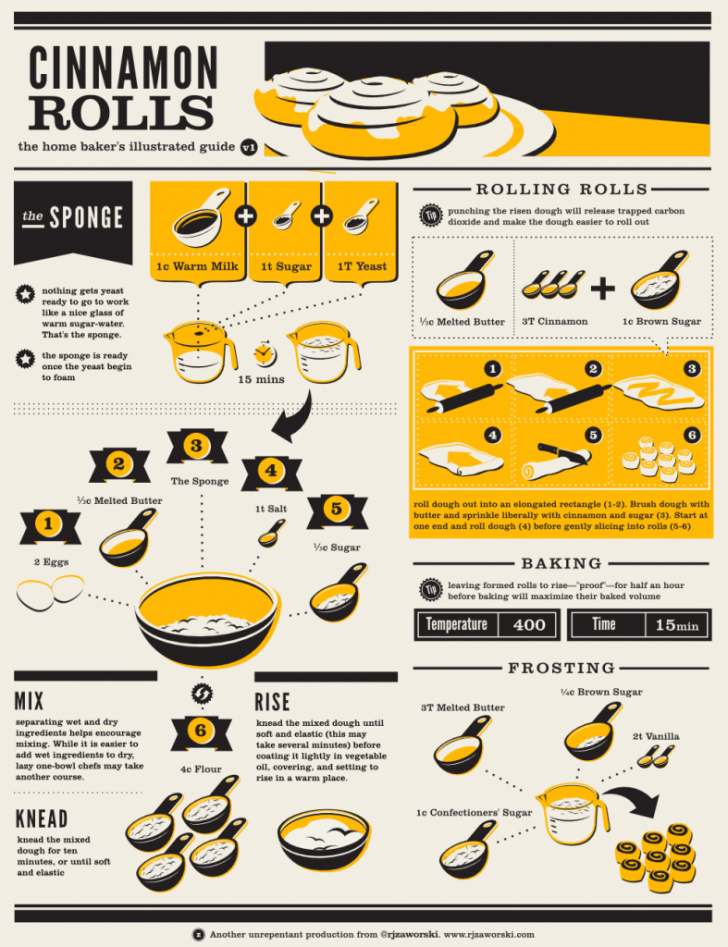
4. Guide To Baking Cinnamon Rolls
An easy way of impressing people this holiday season is homemade cinnamon rolls. And with the help of this chart created by Rj Zaworski, your days of having to use the pre-made cinnamon rolls in a tube are over.
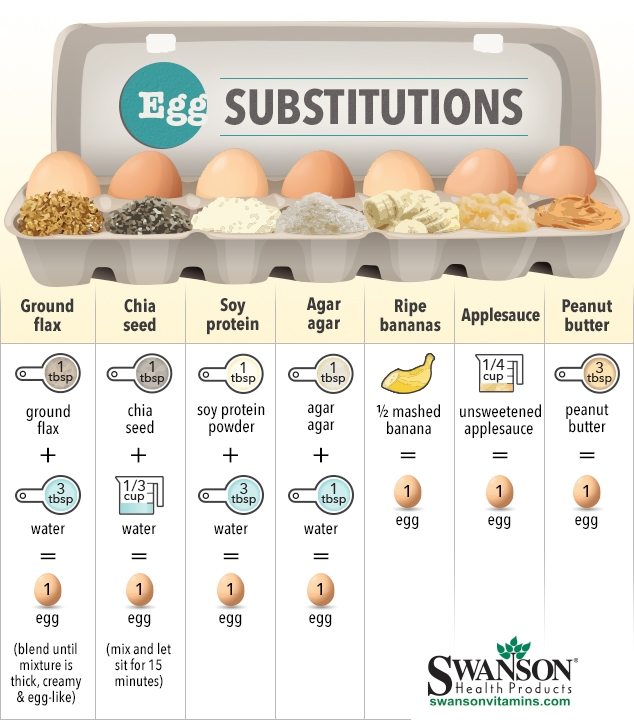
5. Egg Replacement Chart
If you have made the choice to go vegan and are looking for replacements to eggs then this chart from Swanson Health Products is for you. There are a number of ingredients you can use as egg replacements in baking, such as peanut butter, banana and applesauce. This chart doesn’t just apply to vegans, it’s also suitable for people who want to bake only to realize they’re out of eggs.
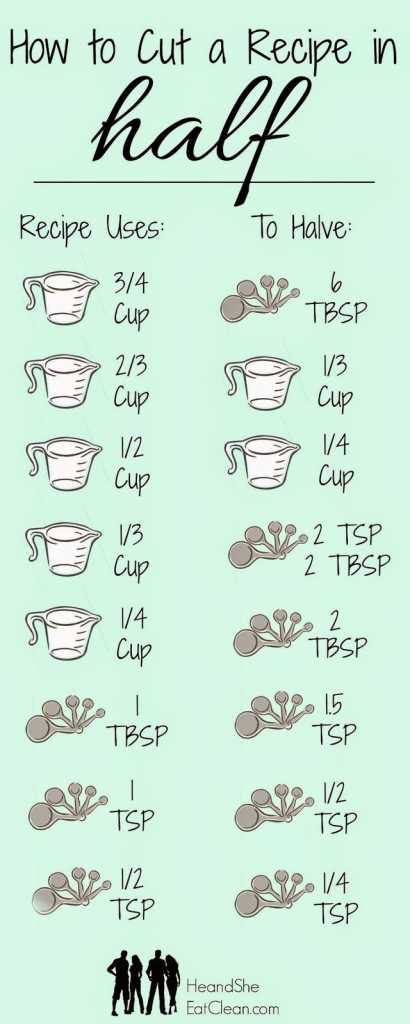
6. Cut A Recipe In Half
Cutting a recipe in half might simple, but it can actually be pretty difficult and sometimes might can end in disaster if you get mixed up when trying to convert between cups, tablespoons, or teaspoons. So, if you are looking for help with measurement reductions, then this chart put out by Photo: He and She Eat Clean will be helpful.
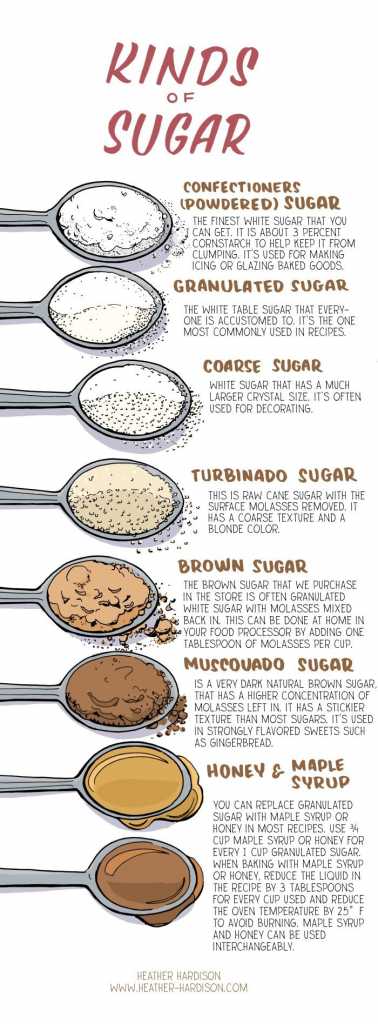
7. Types Of Sugar
Not all sugar is created the same, as this chart from Illustrated Bites demonstrates. Using this, you can learn about the different types of sugar, like muscovado sugar, which is used in most gingerbread recipes, or maple syrup, which can be used as a replacement for granulated sugar.
8. Apple Pie
Nothing beats the classic scent of a homemade apple pie wafting throughout the house. As this chart from Louise Swindells shows how to create the perfect apple pie from scratch. This chart is also perfect for people who are visual learners because of the photographs that accompany the instructions.

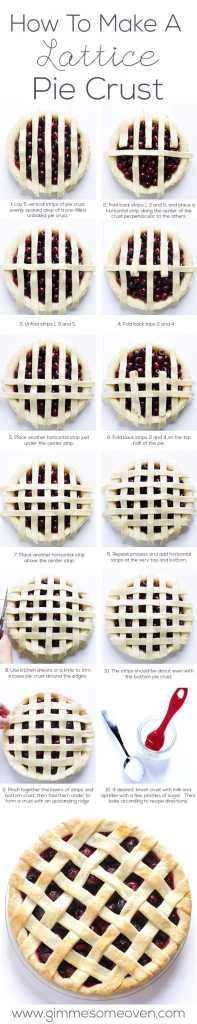
9. Lattice Pie Crust
I’m sure we’ve seen the recipes on social media that show the beautifully designed lattice pie crusts. While Ali Ebright from Gimme Some Oven might not have the same artfully designed pie crusts, she does show how to create a classic checkered pattern with pie dough. “Once you have the strips of dough cut out, it really just takes a minute or two to lay out the pattern, and then pinch the edges together to make your crust,” she writes. Once you master this, I’m sure you can master the fancier designs with practice.
10. Science Of Baking
Baking is a science. We’ve already established that through the importance of precision, oven temps, and ingredient measurements. But, if you want to get more into the science of baking, then the chart from Shari’s Berries covers everything you want to know from flour to shortening to salt.
